A Traveler’s Guide to Digital Transformation
The Five Levels of Data Maturity
More often than not, the businesses making the headlines on your favorite publication are ones that are putting data at the center of their business. Pushing data capabilities beyond the traditional roles, these organizations almost seem to consider it as a revenue source. But is this the path for your organization to take, too? What would it take to compete at this level?
As organizations attain maturity in their digital transformation journeys, insights from business intelligence and analytics are accelerators for growth that business leaders cannot afford to ignore. To make the most of the power of data, it is important that you recognize the milestones in the journey and take a good hard look at your organization’s progress along the path.
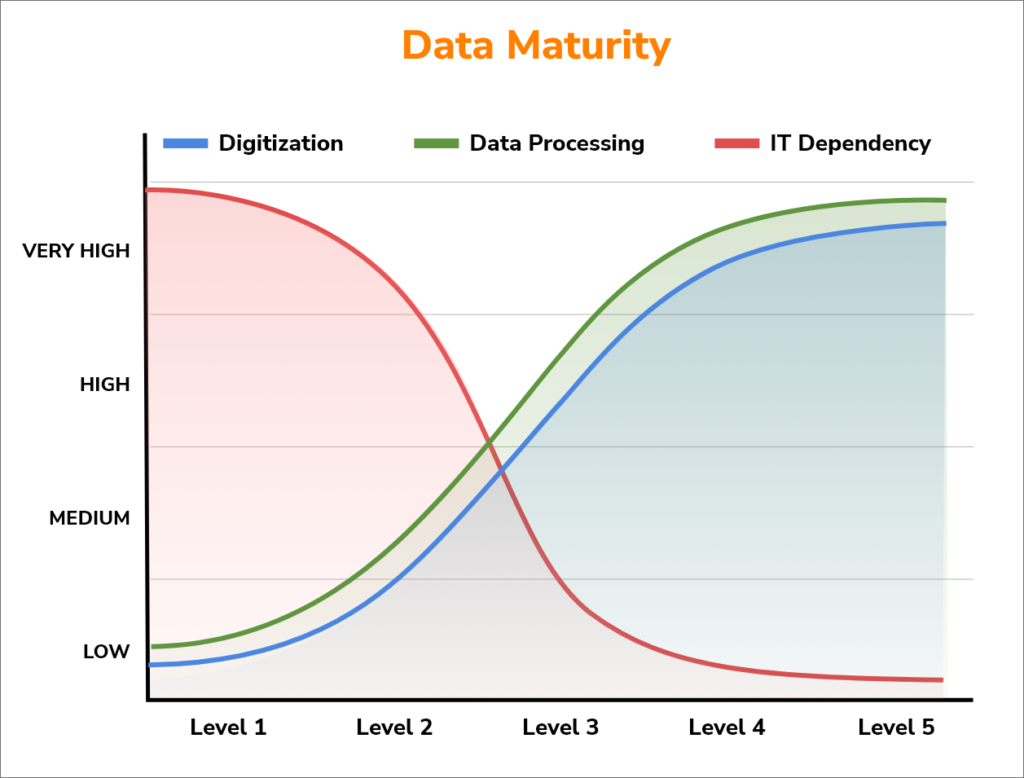
This article will help you gain an understanding of the milestones in the digital transformation journey, viewed from the prism of data maturity. Using the example of a fictitious retail organization, I illustrate the finer points as we track their growth along three dimensions:
- The level of digitalization at each stage,
- The nature of data capturing, processing and reporting, and
- The need for IT support for getting business insights.
The Origin Story: Stand-Alone Systems
Threshold: Capturing data digitally
Outcome: Operational reports
Imagine yourself only a decade ago, shopping at Smiths’, the mom-and-pop grocery store around the corner. Always bustling with customers, the store’s shelves are overflowing, quality is impeccable and the rates are the best in the neighborhood. Mrs. S minds the till and the vendors. Mr. S manages stocks, promotions and deliveries. During holiday season, their two daughters—Jane and Lily—help them manage the rush at the store.
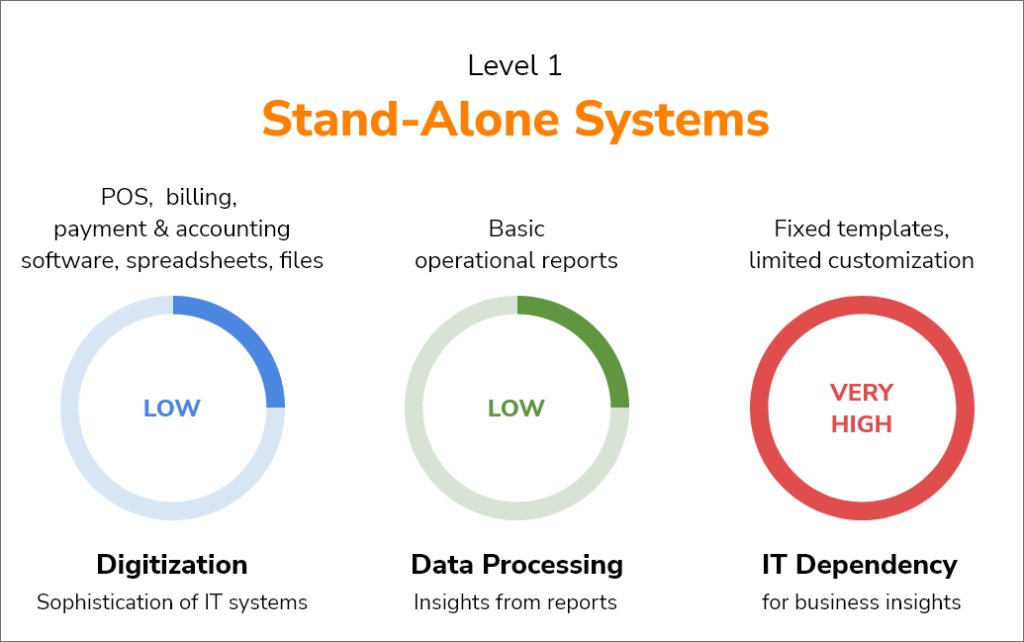
Digitalization is nascent at Smiths’, possibly with one sturdy little Point of Sale (POS) machine with a billing-cum-inventory software being the sole flagbearers of tech. Jane, the Smiths’ elder daughter who is now at college, bought them a PC for Christmas, but it lies mostly unused. By shifting from handling transactions manually to using a computer to manage their data, the Smiths’ have taken the single most important step in their digitalization journey.
Capturing transactional data on a computer is the foundation on which every other level of data maturity rests.
Reporting is standard, a little inflexible and largely operational in nature. The only reports generated are itemized bills, inventory and sales reports and some periodic summaries. These reports are business critical for them, but do not offer much insight or decision support. Jane drops by at every quarter’s end and runs them some reports on Excel, which have actually proved quite useful. However, the Smiths may not have ways to store or analyze historical data, and insights are gained from their lived experiences.
At level 1 of data maturity, the Smiths have little need for an IT guy. Their software system has been bought from a vendor, and a technician calls on them when it’s time for an upgrade. Sometimes, they call the vendor if they need a report changed, if a pesky bug is making life difficult for them or in case of certain changes, for example, if a new tax is introduced and the bill format need to be updated. The Smiths’ need for IT support for routine reports is very low, but their dependence for any customization is absolute. Ad-hoc reports simply aren’t possible unless they export the data to their computer and create them themselves.
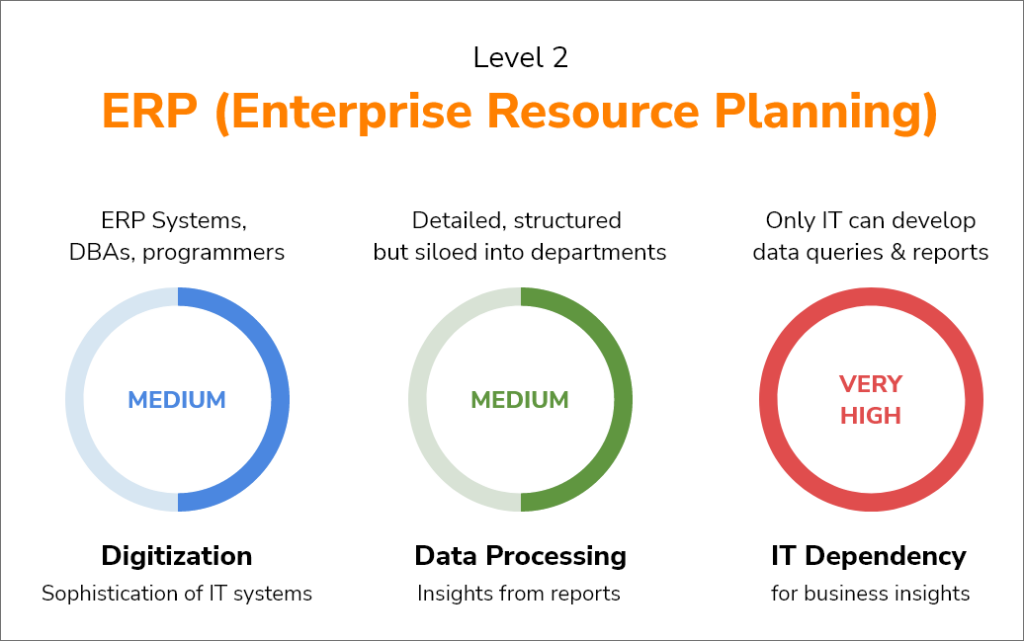
The Age of IT: Enterprise Resource Planning
Threshold: Adopting ERP solutions
Outcome: Strategic reporting
The years have been very good, and mom and pop’s little store has grown with the times. They had bought two more stores in the neighboring districts for their daughters soon as they graduated, one with a degree in computers and the other in business. Accomplished girls that they are, both have flourished and the family has acquired other stores over the past few years. Smiths & Daughters is now a regional chain of stores that spreads across the greater metropolitan area and is thriving due to economies of scale.
With the growing business, the IT infrastructure has changed considerably. In the early years, each of the stores had their own POS machines, stand-alone computers as well as different ways and formats of capturing transactional data. Very quickly, however, the Smiths identified the need and benefits of being able to see data from across the whole chain. First, the HR department recommended using a single database to manage the growing workforce across Smiths & Daughters. A competent specialized solution was bought for the department. The Smiths also realized that economies of scale would be a tremendous benefit if they could manage inventory across all their stores. Jane is now the CTO, and on her advice, the group started adopting specialized ERP solutions for key departments a few years ago.
Smiths & Daughters has reached data maturity level 2 by adopting ERP solutions for all their departments. POS solutions, for now, are still managed separately for each store. The Smiths also plan to replace the distributed customer care setup with a contact center which will have well defined KPIs to boost customer experience.
A majority of organizations—SMEs or large enterprises—are at data maturity level 2.
At level 2, Lily—who is now the CEO—has more data and uses more data points to identify trends and manage the business. Each of the systems produces a wealth of data on key indicators, offered in the form of reams of paper or several gigabytes of data, as the Smiths require. Their decision making has started becoming data-driven. However, reporting has a massive dependency on IT, even for routine reports.
The IT guy has now become a full-fledged IT department. Reports take collaboration between data administrators, programmers, report designers and testers. Should the Smiths desire a new report, someone first raises a ticket. The ticket then must go through an approval cycle within IT before the report can be designed, tested and launched. The Smiths must be ready to wait from somewhere between 30 to 60 days to see the report.
Breaking the Silos: Data Warehousing,
Threshold: Establishing a data warehouse
Outcome: Centralized analytics
Over a decade of combined grit, hard work, sound judgment and early adoption of technology, the Smiths’ little corner store has now grown into Smith Corp, a franchise of nation-wide grocery and white goods stores.
The Smiths—especially Lily, as the CEO—were facing a challenge in keeping the enterprise as profitable as they needed to sustain the momentum. Despite having a world of knowledge about each individual function in their organization, growth has been stagnating and it was hard to put a finger on the reason. Marketing data shows that the campaigns and promotions were always successful, yet sales had plateaued. Sales believes it is a matter of deteriorating customer experience and suggest that HR and the contact center may have the solution to the problem. Both departments counter to say that their KPIs are consistently surpassed every year—the reason must lie somewhere else. Data from different departments is rife with inconsistencies and conflicts. Cross-functional meetings have become tense and fraught, while sales remain lackadaisical.
That was when Jane had tabled the idea of integrating all data into a data warehouse (DWH).
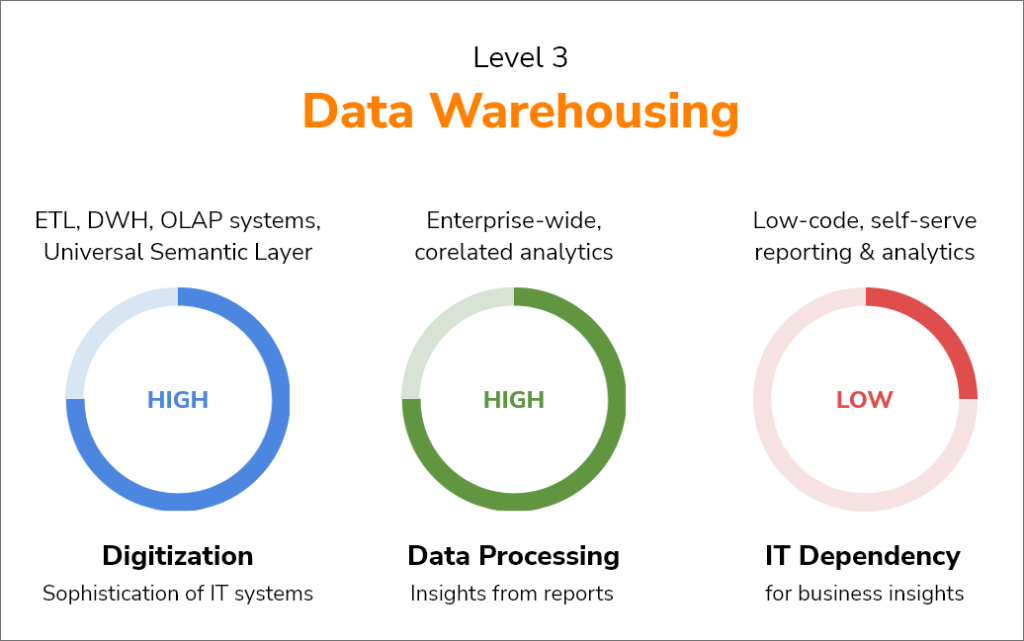
A DWH is the end product of a process called ‘data integration’ which integrates the data pipeline of an organization with the help of ETL. A data integration expert worked with all the departments of Smith Corp to integrate all their data sources and create a unified view of the organization. Smith Corp has a choice of either having all of their ERPs’ entire transactional data in their DWH, or to include only selective and summarized data. In either case, with the creation of a DWH, Smith Corp has arrived at data maturity level 3.
Jane has decided to go a step further and opted for also creating an OLAP DWH rather than stopping at a simple tabular DWH. Periodically—usually on a T-1 basis—Smith Corp’s data is integrated and then aggregated to the Smith Corp DWH. An IT team works to aggregate data at every level and along every dimension possible. This effort pays off dividends in making analytics much faster than they would have been on tabular data.
Data warehousing helps business leaders in getting a unified 360-degree view of KPIs across all functions of their organization.
DWH pulls together internal as well as external data—like area-wise population, holidays and more. Smith Corp is now capable of developing a single dashboard that can assist the leadership in tracking all key KPIs, across all functions of the organization. The DWH has another paradigm altering feature – a ‘universal semantic layer (USL)’, also called an ‘enterprise semantic layer‘, or a ‘meta layer’. Investing in data warehousing and the USL allows any business user in Smith Corp to design and customize a report. They can drill-up or drill-down reports with the click of a mouse, or slice-and-dice data in any direction on their own. Smith Corp can depend on this source of truth to get to the root of any business challenge—all in the matter of a few minutes and without ever having to raise an IT ticket. Armed with the deep insights discovered through a unified source of data, Lily and her family have kept Smith Global agile in spite of the massive volumes of their business. The conflicts among the departments about KPIs are now resolved. They now have the capability of answering questions like “Was customer retention impacted by marketing campaigns? Does the customer’s online activity inform their in-store behavior?”
From Reports to Actionable Insights : Data Science, AI & Machine Learning
Threshold: Using ML for advanced analytics and predictions
Outcome: AI-based deep-dive analytics that maximize insights from every data point
Smith Corp has grown into Smith Global, with a presence across 15 countries, and now has a thriving ecommerce division. The retail giant has quickly become a mandatory case study for every business degree on how to apply scale and technology to accelerate growth. They attribute their success to adopting data science and machine learning (ML).
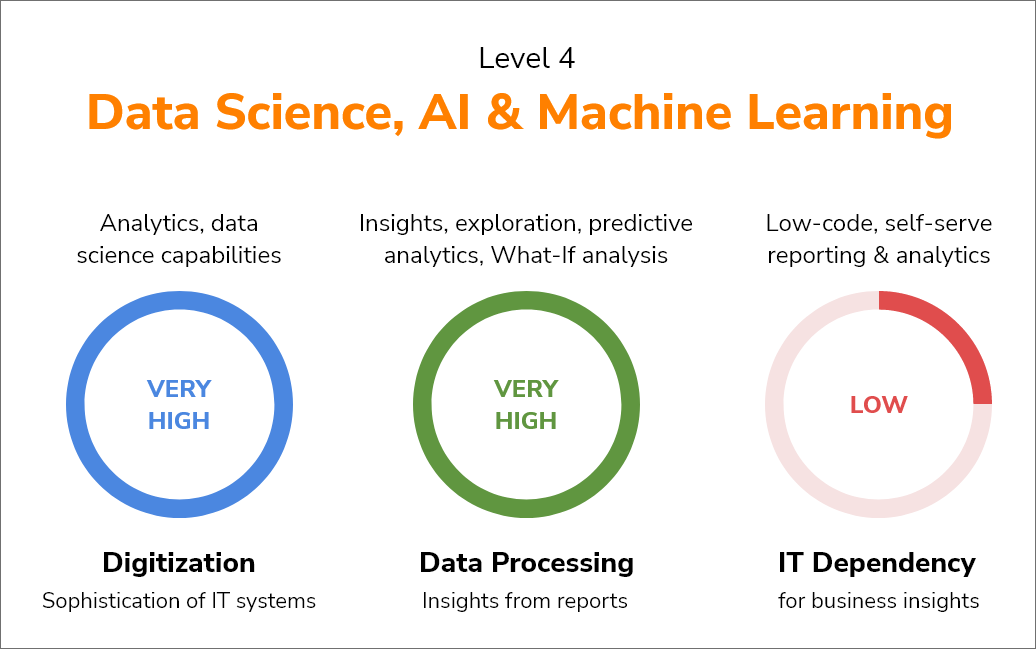
Smith Global has tapped into the power of their historical data through DWH. The business heads have leveraged this data to gain newer, deeper insights that have yielded many benefits. However, all innovations in business and operational models have to be tested on the field, a costly and slow affair. A considerable amount of time goes by before KPIs indicate if a change had, in fact, been beneficial. Some shifts were so fundamental that the associated risks made any steps in that direction impossible. Insights were aplenty but taking action on them was an all-together different ball game. That was when Smith Global decided to ramp up their predictive analytics and data modeling capabilities to solve this problem with what-if analysis, which allows testing models digitally, without the necessity of testing all options on the field.
Data modeling capabilities helps an organization in spotting patterns and making predictions.
A data model consists of a machine learning (ML) component and a predictive algorithm. The ML component learns from historical data. The algorithm uses statistical technologies to combine these learnings with external factors like data about weather, stock market or exchange rates, to name a few, to make predictions. An analytics and BI solution usually supports multiple such algorithms and a business user then assess which predictions worked the best. Alternatively, solutions that support auto-ML have the capability to learn on their own, improving their predictive abilities.
Data modelling with what-if analysis helps in simulating changes in one or more factors that affect Smith Global’s businesses. Not only does this mitigate the risks involved in experimenting in the real world, it also is far quicker and economical.
Smith Global has embedded analytics into their business processes to make accurate predictions about their business, finding more and more efficiencies as their predictive capabilities increase. They are now capable of answering questions like “Are we getting the most value from our supply chain? How do we predict customer behavior and preferences? Which new services do we need to introduce to meet customer expectations? What will be the impact of reducing the risks associated with a global supply chain?”
The Fruits of Labor: Data Monetization
Threshold: Sharing insights with the ecosystem
Outcome: Supplemental revenue stream
All of the Smiths’ investment in their data is now ready to bear yet another fruit as they recently set up a new division – monetizing their rich data. Smith Global’s presence across multiple continents yields insights into multiple domains, markets, supply chains and consumer preferences. Several other businesses are more than enthusiastic about mining those insights. Ka-ching!
Self-serve analytics has enabled a shift in IT focus, from internal reporting to monetizing the asset they have helped build over the years. With this pivot, Smith Global is tapping into revenue streams that their competitors aren’t considering yet. With data monetization, IT and data resources built over the years move from being a cost center to a profit center.
With scale, data operations bring lesser costs and greater profits.
Data monetization is done in two ways – by monetizing analytics and insights , or by monetizing ML data models and predictive capabilities. In either way, ethics, compliance and privacy form the cornerstones of the Smiths’ monetization strategy. Smith Global also uses their data as a foundation for a data-driven business model and for identifying new opportunities to do business with their customers. They expect data to become one of their important revenue streams in a few years. Smith Global is committed to not just creating monetary value for themselves, but also for their entire ecosystem. Their business partners benefit equally from the insights discovered from Smith Global’s rich data and their data-first culture.
The Smiths are now creating synergies while ensuring responsible use of data. The little mom and pop store has indeed come a very long way.
Conclusion
This parable will hopefully have helped you gain a clear understanding of which stage of the digital transformation journey is your organization at today. It will also help in setting realistic expectations about the benefits that can be reaped at each stage. Ask yourself some key questions to gauge your organization’s current data maturity. Are you using different reporting platforms for different functions? Is there a central source of data that removes data conflicts? If yes, how much of your organization’s data resides in it? More often than not, readers will identify their organization on a stage somewhere between level 2 and level 3.
While most business leaders appreciate the benefits of reaching the next level of data maturity, several obstacles lie in the path of attaining that level. Technical and software complexities are often the most common impedances in the path of data maturity. Intellicus offers not just an analytics and business intelligence platform, but also professional services which deliver ‘Analytics and BI as a Service’.
To explore avenues for taking the next step in your digital transformation journey, write to us at marketing@intellicus.com today.
About the author:
 Rajesh Murthy is the Founding Architect & Chief Operating Officer at Intellicus Technologies. He led this spin-off of Impetus Technologies in 2004, which has gone on to acquire more than 17,000 customers, including over half the Fortune 100 companies.
He strategizes business growth and works with clients to deliver transformative scalable solutions and ensures project success Rajesh also serves as VP of Engineering for Kyvos Insights, a BI accelerator layer for big data BI stacks.
Rajesh has graduated from UCVE, Bengaluru, with an Engineering degree in Electronics. He has initiated patented innovative techniques in data processing and visualization for Intellicus. Rajesh loves traveling by road and does some organic farming when at leisure.
Start a conversation with Rajesh at www.linkedin.com/in/rajesh-murthy-59875560


