
Guide To Business Intelligence Reporting

From marketing to production, hiring and expansion, data plays a large role in all strategic decisions organizations make. However, it is easier said than done, considering that enterprise data volumes are increasing by 22.5% every year, as per a report by Statista. Imagine compiling that much data and coming up with insights that are both useful and actionable while also being current.
Business Intelligence (BI) reporting helps simplify the preparation and analysis of colossal amounts of data points in real time. It allows users to create reports, snapshots and insights as and when required. BI reporting gives enterprises the edge in identifying areas of opportunity and making immediate changes to create an impact.
Why Do Businesses Need BI Reporting?
Organizations today collect humongous amounts of data from various sources. But, in most cases, they are unable to gain usable insight from the bulk of it. In fact, 97% of captured data remains unused by enterprises (Gartner), and nearly 74% of employees report unhappiness when working with Data (Accenture). This is where BI reporting provides the necessary wherewithal by helping organizations get timely and accurate data for decision-making. It offers benefits, such as:
Quicker Workflow Speed
Be it a manufacturing business, e-commerce website or SaaS provider, multiple people work on projects or products in a sequence. Most organizations are constantly struggling to turn this workforce into a seamless pipeline. Often, there may be downtime between processes due to a lack of proper knowledge about how to act in a situation or when there’s no proactive data sharing between different teams.
BI reporting can help organizations track processes and discover if there are any bottlenecks or delays. The BI dashboards use real-time data, which can help key stakeholders make faster decisions to improve the workflow, such as adding more people to a project, solving any manufacturing defect or planning tech sprints better.
Lower Operational Costs
Due to the availability of ready-made reports or live dashboards that send out alerts, decision-makers can quickly act on wastages. They can reduce manufacturing errors, allocate budgets for marketing initiatives or optimize manpower for various projects. BI tools allow organizations to prevent heavy losses before it’s too late.
Easier Access to Real-Time and Historical Data
Analyzing large volumes of data and creating simple presentations that can quickly encapsulate the truth of business operations can be challenging. With BI tools, it is easier to create detailed reports and provide context by using historical as well as real-time data. It allows stakeholders to draw insights from anomalies as they are happening and provide comparisons to events that have happened in the past.
Better Strategic Decision-making
CEOs, managers or executives often depend on technical experts to draft reports, carve out projections or create presentations for making strategic decisions. The process, while already cumbersome, can also result in incomplete reports that fail to capture the total picture. BI reporting helps create intuitive reports that provide relevant data which enables decision-makers to quickly spot trends or do a SWOT analysis to arrive at insights instantly.
Broader Organization-Wide Implementation
BI reporting is industry- and department-agnostic. Be it manufacturing, retail, marketing or HR, these tools can be tailor-made to deliver insights that are most relevant to a specific department or industry. Due to a common data source, it can help different departments stay close to the standardized truth for data analysis and interpretation.
Types of BI Reporting
Broadly, BI reporting is divided into two categories based on who prepares the reports; these are Managed Reporting and Ad-Hoc Reporting. Managed reporting is conducted with the help of a technical expert such as an IT associate or data analyst. Ad-hoc reporting enables non-technical users to create reports from scratch or edit existing reports using a BI reporting platform.
BI reporting is also divided based on their characteristics and use cases. Here are the most common types and functionalities.
Self-Service BI: Self-service BI enables non-technical users to analyze data without the need for writing code. Advanced BI platforms run on an associative engine that allows users to manipulate and analyze data in any manner and recalculate analytics or highlight anomalies after each click.
BI Reporting Dashboards: These are interactive visualizations of key data points. It enables a quick understanding of key KPIs. As they work on automation, they can be used by a non-technical user to create output within a few minutes. These dashboards provide pre-made templates that can be used to drag and drop the metrics any stakeholder requires.
Embedded BI: These integrate the business intelligence capabilities with the apps, portals, products or processes of a business. It enables users, such as customers or partners as well as employees, to quickly access data and analyze insights in their routine workflow rather than having to switch to a separate app.
Static BI: This is more like traditional BI reporting where static reports and graphs are created by the platform for stakeholders. It is more relevant for smaller teams or when making more granular business decisions, such as extracting the past week’s numbers in a small sales meeting.
Mobile BI: Mobile BI enables users to share insights and collaborate on any device, making decisions on the fly. The system translates static BI and interactive dashboards to a mobile screen.
How Does BI Reporting Work?
Business Intelligence reporting is the act of visualizing data in the form of reports or dashboards to make informed business decisions. Traditional BI was often cumbersome and required extensive data modeling and deep knowledge of SQL. However, with the advent of modern BI tools, the process has been reduced to just a few easy steps.
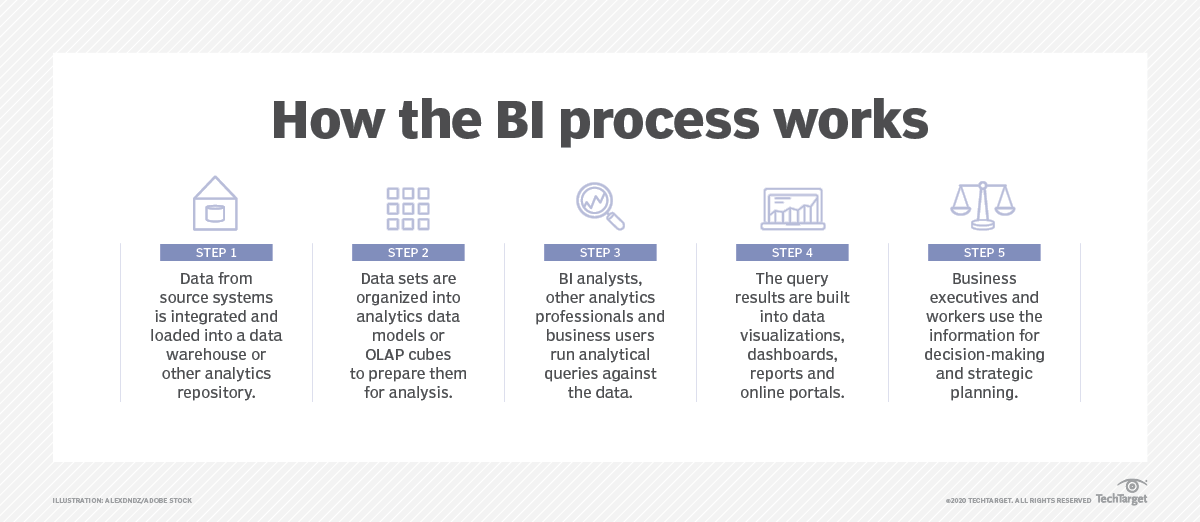
The process starts when data from various source systems such as CRM, ERP or transactional databases is integrated and loaded into a data warehouse or an analytics repository. These analytics repositories could be data marts, which are smaller subsets of data specific to individual departments or business units or entire data lakes which are part of the enterprise data storage.
The data sets are then organized into various analytics models or OLAP cubes by integration, consolidation and cleansing. Data integration and quality management tools prepare data for analysis with accurate and consistent information. The BI data is now accessed by the tools through queries run by analysts in the case of a managed reporting system or through queries run automatically by the BI reporting tool.
Business intelligence tools access data from various data sources on-premises or on the cloud. They identify metrics such as sales figures, revenue, product inventory, etc., and apply qualifier filters such as data, purchase order number or customer details for deep analysis. Users can create reports based on the filters with a simple drag-and-drop function. These tools provide a wide variety of visual representations such as tables, histograms, pie charts, etc., depending on the data and forecasting models chosen. The tools also help create live dashboards that update on schedule or in real-time.
Finally, these dashboards and visualizations are used by business users, such as executives, managers, and CEOs, to make informed decisions.
Source: https://www.techtarget.com/searchbusinessanalytics/definition/business-intelligence-BI
How to Choose the Right Business Intelligence Reporting Platform
Choosing the right business intelligence reporting platform is a critical business decision. It is important to keep in mind the complexity of the data used by the business, the technical expertise of the team as well as any other requirements that are specific to a business.
The right business intelligence reporting platform must be able to connect with any data source or application and provide a unified analytical insight across the enterprise. It should be secure and scalable to meet the growing needs of the organization. By using robust role definition and permission management, the platform should provide granular access control.
The best platforms are also intuitive and easy to use even for non-technical users, with their simple drag-and-drop interface and an exhaustive library of visualizations. They are deployable anywhere—on-premises, on the cloud, or as a fully managed subscription-based SaaS. Ultimately, the right business intelligence reporting platform should enable the business to optimize processes, enhance customer experience and discover new opportunities quickly.
Conclusion
The global business intelligence market is expected to grow to $33.3Bn by 2025, indicating the rapid adoption of BI tools in enterprises. In this, the role of mobile BI is going to be significant as it is expected to grow at 22.43% CAGR, indicating the need for BI reporting to be available on multiple devices for seamless operation.
Most enterprise systems will start shipping with advanced AI-driven and built-in BI capabilities so users can make decisions on the go without having to switch platforms or even turn on laptops. BI reporting tools are no longer just good to have; they are a necessary means to generate competitive advantage and help enterprises make critical business decisions quickly and confidently.