|
|
|
|
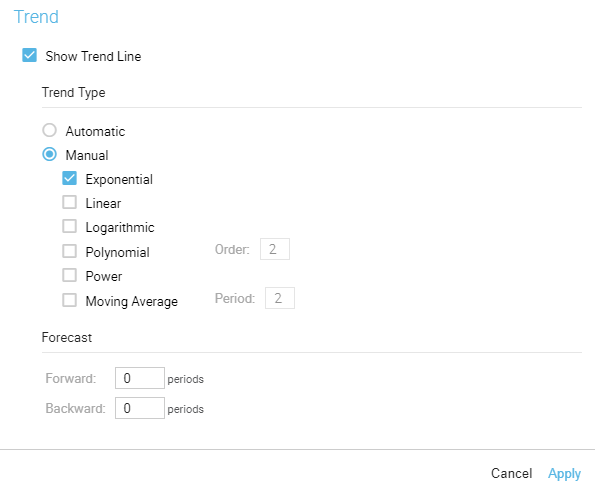
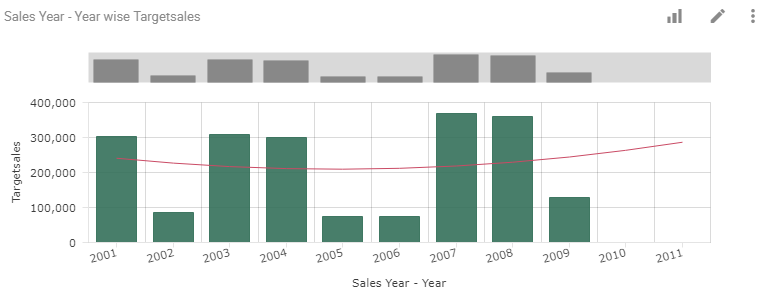
A trend line in Intellicus can be used to depict trends in your existing data or forecasts of future data. Example, you can see the trend of sales values across years and forecast the future.
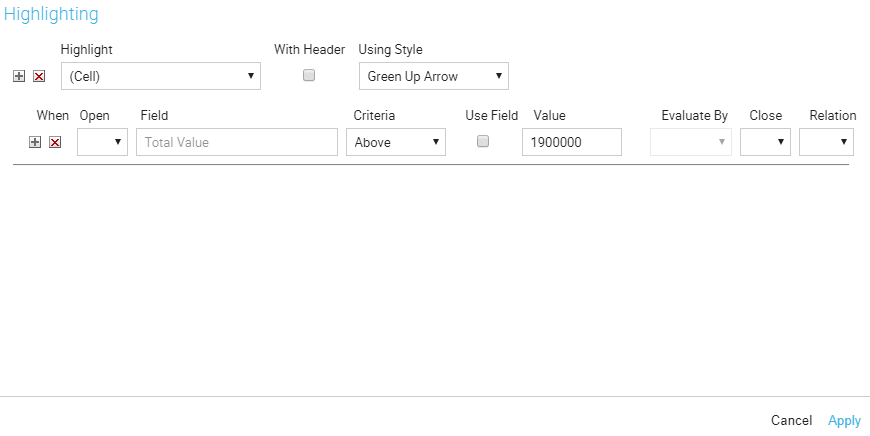
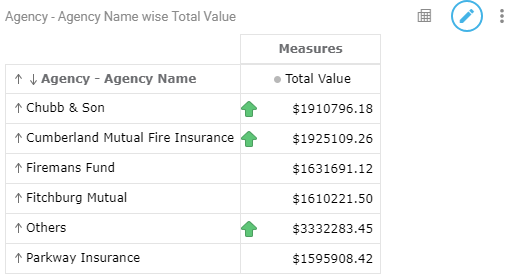
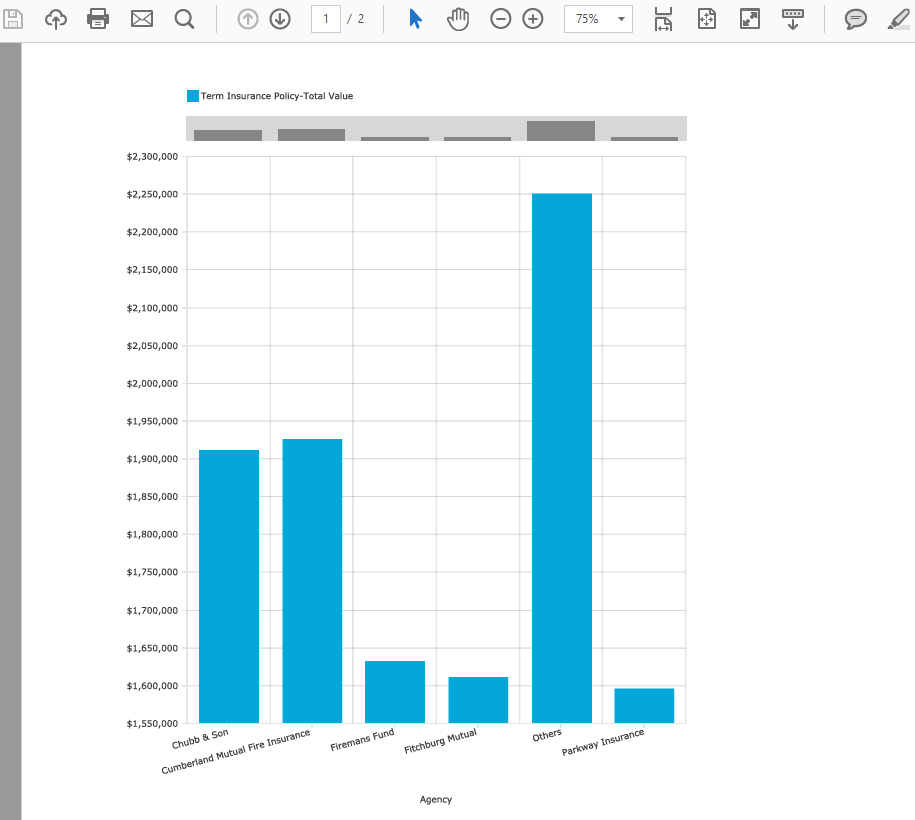
You can specify the criteria to highlight measure row, column or cell in the grid on High Speed View. Example, you can highlight the cells with Total Value above 1900000 as shown below:
You can now schedule to run a high speed report at a chosen date and time. High speed reports can be scheduled to run periodically and also have the results automatically emailed to users.
With Intellicus 16.2, you can export the high speed reports to MS-Word/Excel/PowerPoint in their respective native formats. This facilitates you to perform various Office operations on your exported reports. You can also export your report to Acrobat PDF format.
The cells in crosstab or chart can be hyperlinked in high speed reports.
In case of a hyperlinked field (specified at the query object level), you can drill down to open a smart report or external URL on clicking the value of field on crosstab or chart.
This hyperlinked value acts as a parameter for the linked report.